ceviz
Ceviz automatically scans your codebase and detects performance issues that slow down your application:

🌰 Ceviz
Lightning-fast performance analyzer for all npm packages
🌰 Ceviz automatically scans your codebase and detects performance issues that slow down your application:
- 🔍 O(n²) and O(n³) complexity - Nested loops and inefficient algorithms
- 💾 Memory leaks - Unclosed intervals, event listeners, and memory bloat
- 📡 Blocking operations - Synchronous file I/O and CPU-heavy operations
- ⚡ Waterfall requests - Sequential async operations that could be parallel
- 📦 Bundle bloat - Heavy dependencies and unnecessary imports
Features
- ✅ Zero configuration - Works out of the box
- ⚡ Blazing fast - Powered by OXC (Rust-based parser)
- 🎯 Accurate detection - AST-based analysis finds real issues
- 📊 Beautiful reports - Console, JSON, and interactive HTML output
- 🔧 Actionable suggestions - Get specific fixes for each issue
- 🚀 CI/CD ready - Exit codes for automated checks
- 🌰 Plugin system - Create custom rules and reporters
- 🎨 VSCode integration - Click to open files from HTML reports
Installation
# Run without installing
npx ceviz analyze

# Or install globally
pnpm add -g ceviz

# Or add to your project
pnpm add -D ceviz
ESLint Plugin
Real-time performance linting in your editor:
pnpm add -D eslint-plugin-ceviz
// eslint.config.js
import ceviz from 'eslint-plugin-ceviz'

export default [ceviz.configs.recommended]
See eslint-plugin-ceviz for details.
Usage
Basic Analysis (User Code)
# Analyze current directory
ceviz analyze

# Analyze specific path
ceviz analyze ./my-project

# Output as JSON
ceviz analyze --json

# Save JSON to file
ceviz analyze --json report.json

# Generate interactive HTML report (auto-opens in browser)
ceviz analyze --html
ceviz analyze --html report.html

# Use custom config file
ceviz analyze --config ceviz.config.ts
Configuration File
Create ceviz.config.ts in your project root for full TypeScript autocomplete and type checking:
import { defineConfig } from 'ceviz'

export default defineConfig({
  // Load custom plugins
  plugins: [
    'ceviz-plugin-vue',
    './my-custom-plugin.js'
  ],

  // Configure rules
  rules: {
    'nested-loops': 'error',
    'no-console-log': 'off'
  },

  // Output reporters
  reporters: ['console', 'html'],

  // Framework analysis
  scanDeps: false,
  targetDeps: ['nuxt', 'vite']
})
Benefits of defineConfig:
- ✅ Full TypeScript autocomplete
- ✅ Type checking for all options
- ✅ IntelliSense for rule names and severity levels
- ✅ Vite/Nuxt-style DX powered by c12
Framework Analysis
Ceviz can also analyze framework code in node_modules to help you report performance issues to maintainers:
# Analyze any framework in your node_modules
ceviz analyze . --scan-deps --target-deps nuxt,vite,vue
For detailed framework analysis instructions, see FRAMEWORK_ANALYSIS.md.
Example Output
⚡ Ceviz Performance Analysis
────────────────────────────────────────────────────────────

📊 Summary
────────────────────────────────────────────────────────────
  Files analyzed:     147
  Total issues:       12
    ● Critical:      5
    ● Warnings:      7
    ● Info:          0
  Performance score:  72/100 👍
  Analysis time:      1234ms

🔴 Critical Issues
────────────────────────────────────────────────────────────

  ⚡ CRITICAL: Nested loop detected (O(n²) complexity)
     server/api/users.ts:42
     Impact: 100ms → 10s for 1000 items
     Complexity: O(n²)
     → Use Map/Set for O(1) lookups instead of nested loops

  ⚡ CRITICAL: Array.find() inside loop creates O(n*m) complexity
     composables/useData.ts:78
     Impact: 10ms → 5s for 1000x1000 items
     → Convert array to Map/Set before the loop for O(1) lookups

  💾 CRITICAL: setInterval without cleanup causes memory leak
     components/LiveData.vue:156
     Impact: Memory grows indefinitely
     → Clear interval in onUnmounted lifecycle

  📡 CRITICAL: readFileSync() blocks the event loop
     server/api/config.ts:12
     Impact: 50-200ms block per call
     → Use async version: readFile()

📈 Performance Metrics
────────────────────────────────────────────────────────────
  CPU
    Worst complexity:  O(n²)
    Hotspots:          5 locations

  Memory
    Est. baseline:     450MB
    Memory leaks:      2
    Bloat level:       medium

  Bundle
    Current size:      1.2MB
    Potential savings: 458KB
    Heavy deps:        moment, lodash

  I/O
    Blocking ops:      1
    Waterfalls:        3

💡 Quick wins:
  1. Fix critical O(n²) loops → use Map/Set for lookups
  2. Replace sync file operations → use async versions
  3. Clean up memory leaks → add proper cleanup
What Ceviz Detects
CPU Issues
Nested Loops (O(n²))
// ❌ BAD - O(n²)
users.forEach((user) => {
  posts.forEach((post) => {
    if (post.userId === user.id) {
      // ...
    }
  })
})

// ✅ GOOD - O(n)
const postsByUser = new Map()
for (const post of posts) {
  if (!postsByUser.has(post.userId)) {
    postsByUser.set(post.userId, [])
  }
  postsByUser.get(post.userId).push(post)
}
Array.find() in Loop
// ❌ BAD - O(n*m)
items.filter((item) => {
  const category = categories.find(cat => cat.id === item.categoryId)
  return category?.active
})

// ✅ GOOD - O(n)
const categoryMap = new Map(categories.map(c => [c.id, c]))
items.filter(item => categoryMap.get(item.categoryId)?.active)
Memory Issues
Unclosed Intervals
// ❌ BAD - Memory leak
const interval = setInterval(() => {
  fetchData()
}, 1000)

// ✅ GOOD - Cleaned up
const interval = setInterval(() => {
  fetchData()
}, 1000)

onUnmounted(() => {
  clearInterval(interval)
})
I/O Issues
Synchronous File Operations
// ❌ BAD - Blocks event loop
const data = fs.readFileSync('file.txt', 'utf-8')

// ✅ GOOD - Non-blocking
const data = await fs.promises.readFile('file.txt', 'utf-8')
Sequential Async Operations
// ❌ BAD - Waterfall (3x slower)
const user = await fetchUser()
const posts = await fetchPosts()
const comments = await fetchComments()

// ✅ GOOD - Parallel
const [user, posts, comments] = await Promise.all([
  fetchUser(),
  fetchPosts(),
  fetchComments()
])
Rules
Ceviz currently has 5 core rules:
| Rule | Category | Severity | Description |
|---|---|---|---|
nested-loops |
CPU | Critical | Detects O(n²) or worse nested loops |
array-find-in-loop |
CPU | Critical | Detects O(n*m) array operations in loops |
memory-leak-interval |
Memory | Critical | Detects unclosed intervals/timeouts |
sync-file-operations |
I/O | Critical | Detects blocking file operations |
sequential-requests |
I/O | Warning | Detects parallelizable async operations |
More rules coming soon!
Plugin System
Ceviz supports a powerful plugin system for creating custom rules and reporters.
Creating a Custom Plugin
// ceviz-plugins/my-plugin.ts
import type { CevizPlugin, Rule } from 'ceviz'

const myRule: Rule = {
  id: 'no-console-log',
  name: 'No Console Log',
  category: 'framework',
  severity: 'warning',
  description: 'Detects console.log in production code',
  enabled: true,
  check: (context) => {
    // Your analysis logic
    return []
  },
}

const myPlugin: CevizPlugin = {
  name: 'my-custom-plugin',
  version: '1.0.0',
  rules: [myRule],
  setup: async (context) => {
    // Listen to hooks
    context.hooks.hook('analysis:start', () => {
      console.log('Starting analysis...')
    })
  },
}

export default myPlugin
Using Plugins
// ceviz.config.ts
import { defineConfig } from 'ceviz'
import myPlugin from './ceviz-plugins/my-plugin.js'

export default defineConfig({
  plugins: [
    myPlugin,
    'ceviz-plugin-vue', // Or from npm
  ],
})
See PLUGIN_API.md for complete plugin documentation.
CI/CD Integration
Ceviz exits with code 1 if critical issues are found, making it perfect for CI/CD:
# GitHub Actions
name: Performance Check
on: [pull_request]

jobs:
  ceviz:
    runs-on: ubuntu-latest
    steps:
      - uses: actions/checkout@v3
      - uses: pnpm/action-setup@v2
      - run: pnpm dlx ceviz analyze
Real-World Results
Ceviz can analyze any npm package and detect performance issues:
- Array operations in loop (O(n*m))
- Nested loops (O(n²))
- Sequential async operations (waterfalls)
- Synchronous file operations
- Memory leaks
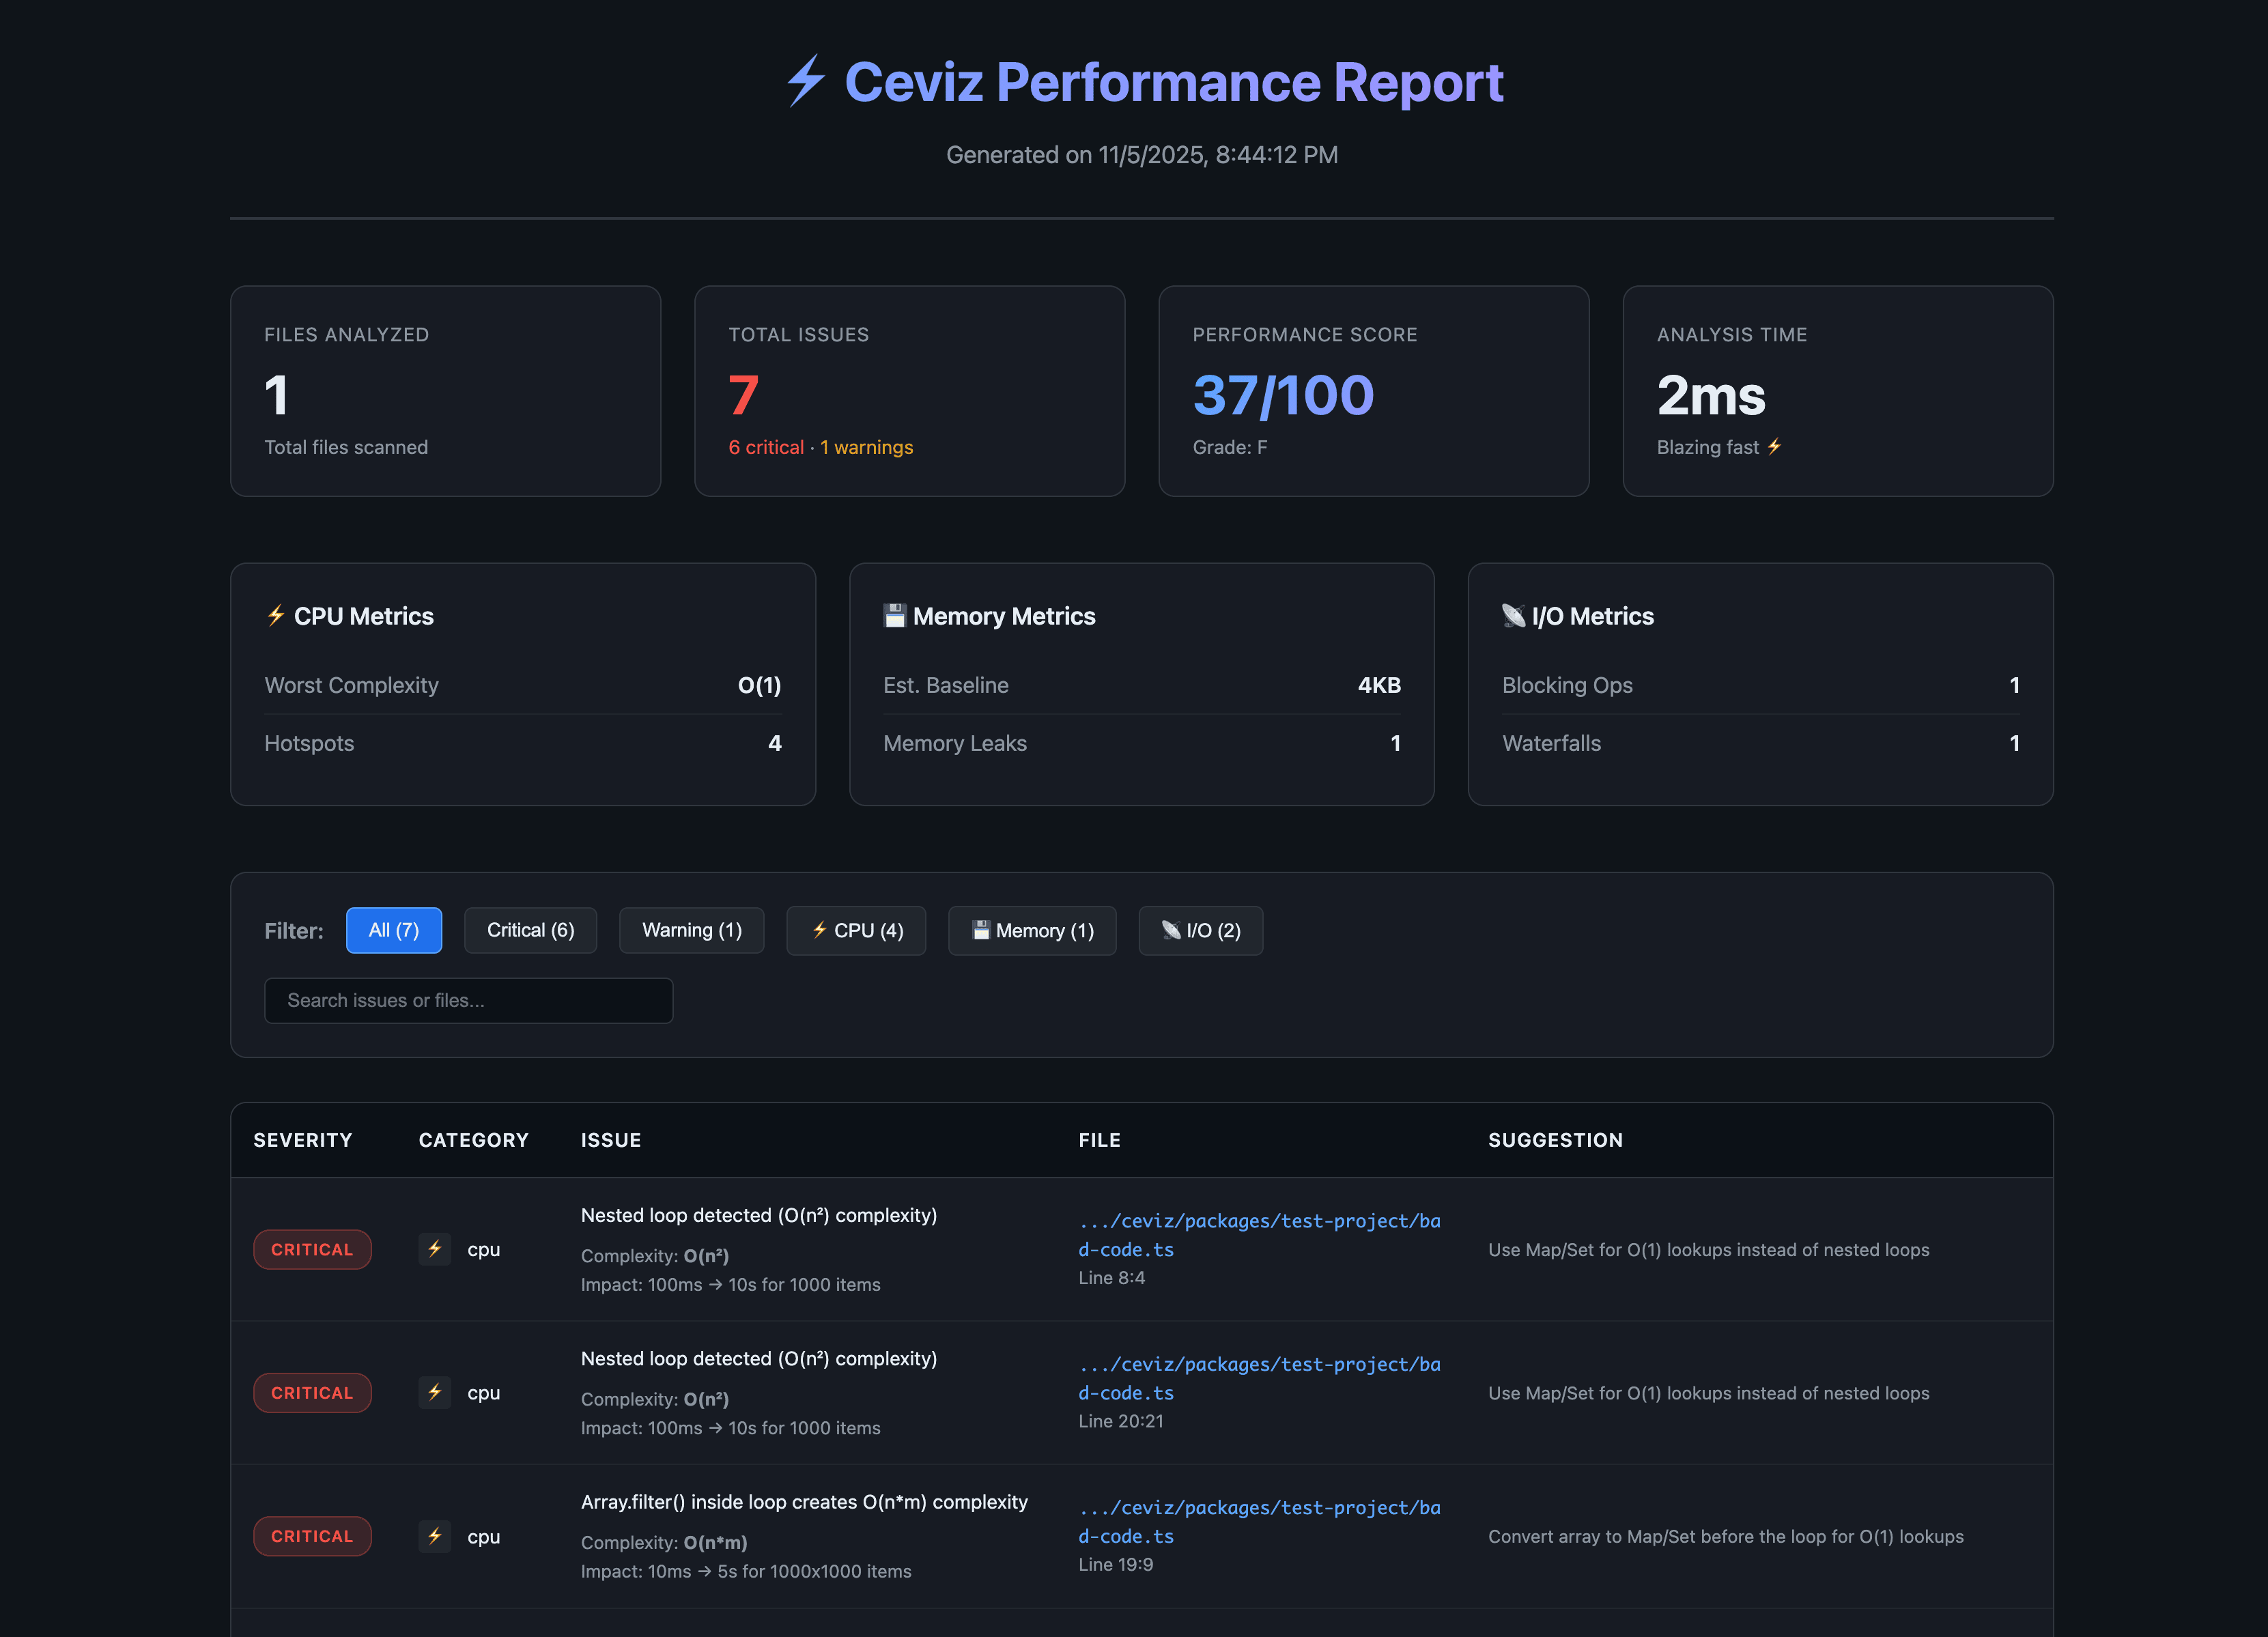
Run ceviz analyze --html to generate an interactive HTML report with detailed findings.
Roadmap
Tech Stack
- OXC - Lightning-fast Rust-based parser (50-100x faster than Babel)
- Rolldown - Next-gen bundler for bundle analysis
- TypeScript - Type-safe codebase
- Commander - CLI interface
- Chalk - Beautiful console output
Contributing
We’re building something special here, and we want YOU to be part of it!
Ceviz is more than just a tool - it’s a movement to make performance analysis accessible, accurate, and actionable for everyone. We’re 100% open to contributions and wildly open to new ideas.
Our Vision
We want to take Ceviz far beyond what it is today. Our goal is to build the most comprehensive, accurate, and delightful performance analysis tool in the JavaScript ecosystem - analyzing everything from the smallest edge case to framework-level performance issues.
We Need Your Help
Whether you’re:
- 🐛 Finding bugs - Help us catch edge cases
- 💡 Suggesting features - Share your wildest ideas
- 🔧 Writing code - Contribute rules, reporters, or core features
- 📝 Improving docs - Make Ceviz easier to understand
- 🎨 Designing UX - Help us build better reports and visualizations
- 🧪 Testing - Run Ceviz on your projects and share results
- 🌍 Spreading the word - Tell others about Ceviz
Every contribution matters! We’re completely open to:
- New detection rules (regex catastrophic backtracking, excessive re-renders, etc.)
- Framework-specific analyzers (Nuxt, Next.js, Remix, SvelteKit, Solid)
- Better reporting formats (PDF, CI annotations, Slack/Discord integrations)
- Auto-fix capabilities
- VS Code extension
- Performance benchmarking
- Your crazy ideas we haven’t thought of yet!
How to Contribute
- Check existing issues or open a new one to discuss your idea
- Fork the repo and create a branch
- Make your changes - write tests if applicable
- Submit a PR with a clear description
We review PRs quickly and are happy to mentor new contributors!
Let’s Build the Ecosystem Together
Ceviz is just getting started. With your help, we can make it the go-to tool for performance analysis across the entire JavaScript ecosystem. Let’s build something amazing together!
Join us: GitHub Issues
License
MIT © Ceviz Team
Built with ❤️ for all npm packages